Radius of gyration and distances
(459)¶\[R_g ~=~ \left({\frac{\sum_i \|{\bf r}_i\|^2 m_i}{\sum_i m_i}}\right)^{{\frac{1}{2}}}\]
(460)¶\[R_{g,x} ~=~ \left({\frac{\sum_i \left( r_{i,y}^2 + r_{i,z}^2 \right) m_i}{\sum_i m_i}}\right)^{{\frac{1}{2}}}\]
Sometimes it is interesting to plot the distance between two atoms, or the minimum distance between two groups of atoms (e.g.: protein side-chains in a salt bridge). To calculate these distances between certain groups there are several possibilities:
The distance between the geometrical centers of two groups can be calculated with the program gmx distance, as explained in sec. Bonds/distances, angles and dihedrals.
The minimum distance between two groups of atoms during time can be calculated with the program gmx mindist. It also calculates the number of contacts between these groups within a certain radius \(r_{max}\).
gmx pairdist is a selection-enabled version of gmx mindist.
To monitor the minimum distances between amino acid residues within a (protein) molecule, you can use the program gmx mdmat. This minimum distance between two residues A\(_i\) and A\(_j\) is defined as the smallest distance between any pair of atoms (i \(\in\) A\(_i\), j \(\in\) A\(_j\)). The output is a symmetrical matrix of smallest distances between all residues. To visualize this matrix, you can use a program such as
xv. If you want to view the axes and legend or if you want to print the matrix, you can convert it with xpm2ps into a Postscript Fig. 57.
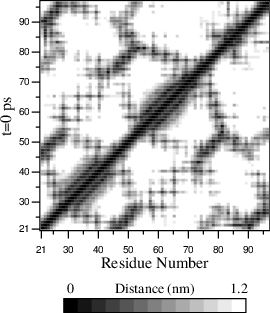
Plotting these matrices for different time-frames, one can analyze changes in the structure, and e.g. forming of salt bridges.